
You want to enter the data field
Start with the core concepts, then progress through Excel, SQL and Power BI until you can complete an end-to-end analysis project.
Don’t learn Excel, SQL and Power BI as disconnected tools. In this bootcamp, you’ll use them to solve real business problems and build dashboards, reports and projects you can showcase on your CV, LinkedIn and in interviews.
The tools and skills you’ll master in this bootcamp
Is this bootcamp right for you?
This path is designed to move you from understanding to execution. You don’t need to already be a data analyst—you need the willingness to practice and build real projects as you learn.
Start with the core concepts, then progress through Excel, SQL and Power BI until you can complete an end-to-end analysis project.
Move beyond traditional reports into SQL, data modeling, DAX and more professional interactive dashboards.
Learn how to choose the right KPIs, analyze performance and present findings in language decision-makers understand.
Learn Power BI, DAX and data modeling through practice while connecting those skills to the core PL-300 objectives.
Real student projects
These are real data analysis projects built by Athar Academy students. Open any project and see the level of practical work you can aim to add to your own portfolio.
A student-built project showing how raw data becomes clear KPIs that make performance easier to understand and act on.
A student project that demonstrates how to structure data and turn it into an interactive, easy-to-use dashboard.
A hands-on project showing how analytics tools can answer business questions and communicate results professionally.
A project focused on spotting trends, identifying strengths and gaps, and turning findings into useful business insights.
A practical bootcamp project combining analysis with polished outputs that can be added to a professional portfolio.
A capstone that brings the full workflow together, from understanding the data to producing a shareable analysis and dashboard.
Your journey through the bootcamp
You won’t be trained to memorize clicks. You’ll learn why each step matters, what question it answers, how to validate the result, and how to present it clearly.
Turn the problem into measurable questions and define the right KPIs before you touch the data.
Clean data with Excel and Power Query, then use SQL to retrieve the information you need with confidence.
Use Power BI, DAX and data modeling to turn your analysis into useful KPIs and interactive dashboards.
Package your projects, improve your CV and LinkedIn, and prepare to explain how you think in interviews—not just list the tools you know.
Curriculum
The journey is clearly separated: a foundation level for core analyst skills, an advanced level focused on Statistics & Business Analysis and executive analytics, plus an optional Python track for broader technical depth.
Included in every enrollment path, from zero through Power BI, PL-300 preparation and portfolio building.
Included in the Foundation + Advanced path and designed for learners who already understand the core Excel, SQL and Power BI workflow.
Included in the Data Analysis + Python bundle and delivered as a flexible self-paced track alongside the foundation bootcamp.
Education consultant at Athar Academy with more than 7 years of experience in data training, analysis and engineering.
Data analyst with more than 5 years of experience in Saudi Arabia’s financial sector and a CFA qualification.
Data analytics and business intelligence specialist with a master’s degree and multiple local awards.
Preparation focused on the practical Power BI, DAX and data-modeling skills covered by PL-300.
Present your projects so the problem, your analysis and the outcome are clear.
Present your skills and projects more clearly to recruiters and hiring managers.
Practice explaining your analytical thinking and build a practical application strategy.
You’ll have projects you can open and present, interactive dashboards, hands-on experience with Excel, SQL, Power BI and DAX, and a practical understanding of KPIs and decision-focused analysis—plus PL-300 preparation and career support.
Why is this experience different?
Every part of the bootcamp serves a clear outcome: a project, a measurable skill or a career step that moves you forward.
Instead of learning tools in isolation, you’ll use Excel, SQL and Power BI in one connected workflow that mirrors real work.
Graduate with projects that demonstrate your ability to employers instead of relying on a list of skills.
Top-performing students may receive an IBM training opportunity that adds another layer of practical experience.
Receive 3 months of post-graduation support to improve your projects and keep moving forward professionally.
Student experiences
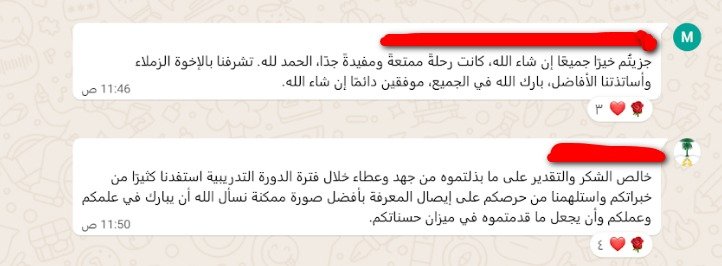
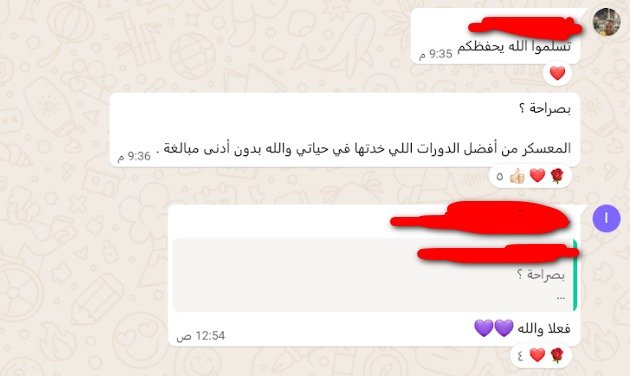
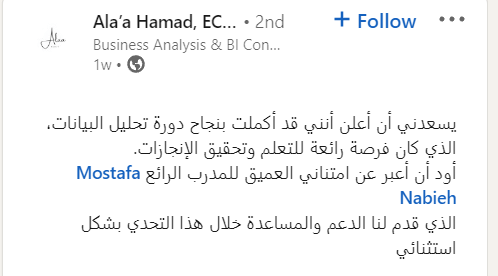
Real student feedback about the content, hands-on work and support. Click any review to read it at a larger size.



Step 1 of 2
Choose the foundation level, add Python as a complementary track, or take the complete journey from fundamentals through the advanced level.
Start from zero and build a strong foundation in Excel, SQL, Power BI and DAX, with portfolio projects and Microsoft PL-300 preparation.
Get the complete foundation level plus the self-paced Python for Data Analysis bootcamp.
Start with the foundation level, then continue into Statistics & Business Analysis, Python, advanced SQL, production-grade Power BI and Microsoft Fabric — both levels are now available together at a special price.
Step 2 of 2
Choose between the October or November cohort. Sessions are held on Saturday and Monday at 7:00 PM Saudi time. If these times do not work for you, choose the private 1-to-1 path and train on a schedule that fits you.
Saturday & Monday • 7:00 PM (Saudi time)
What’s included in your enrollment?
Instead of collecting separate courses for each tool, you get one connected path that shows you what to learn, why it matters and where to use it in a real project.
Before you enroll
If you still have a question, talk to a training advisor before completing your enrollment.
Start from your current level, work with real data and projects, and build a portfolio that shows how you turn data into clear decisions and deliverables.
Want to receive push notifications for all major on-site activities?